Thursday, August 13, 2015

Humans cling to their primal fear of the dark

Local Group

Humans cling to their primal fear of the dark

Posted by Eric Betz
on Wednesday, July 29, 2015
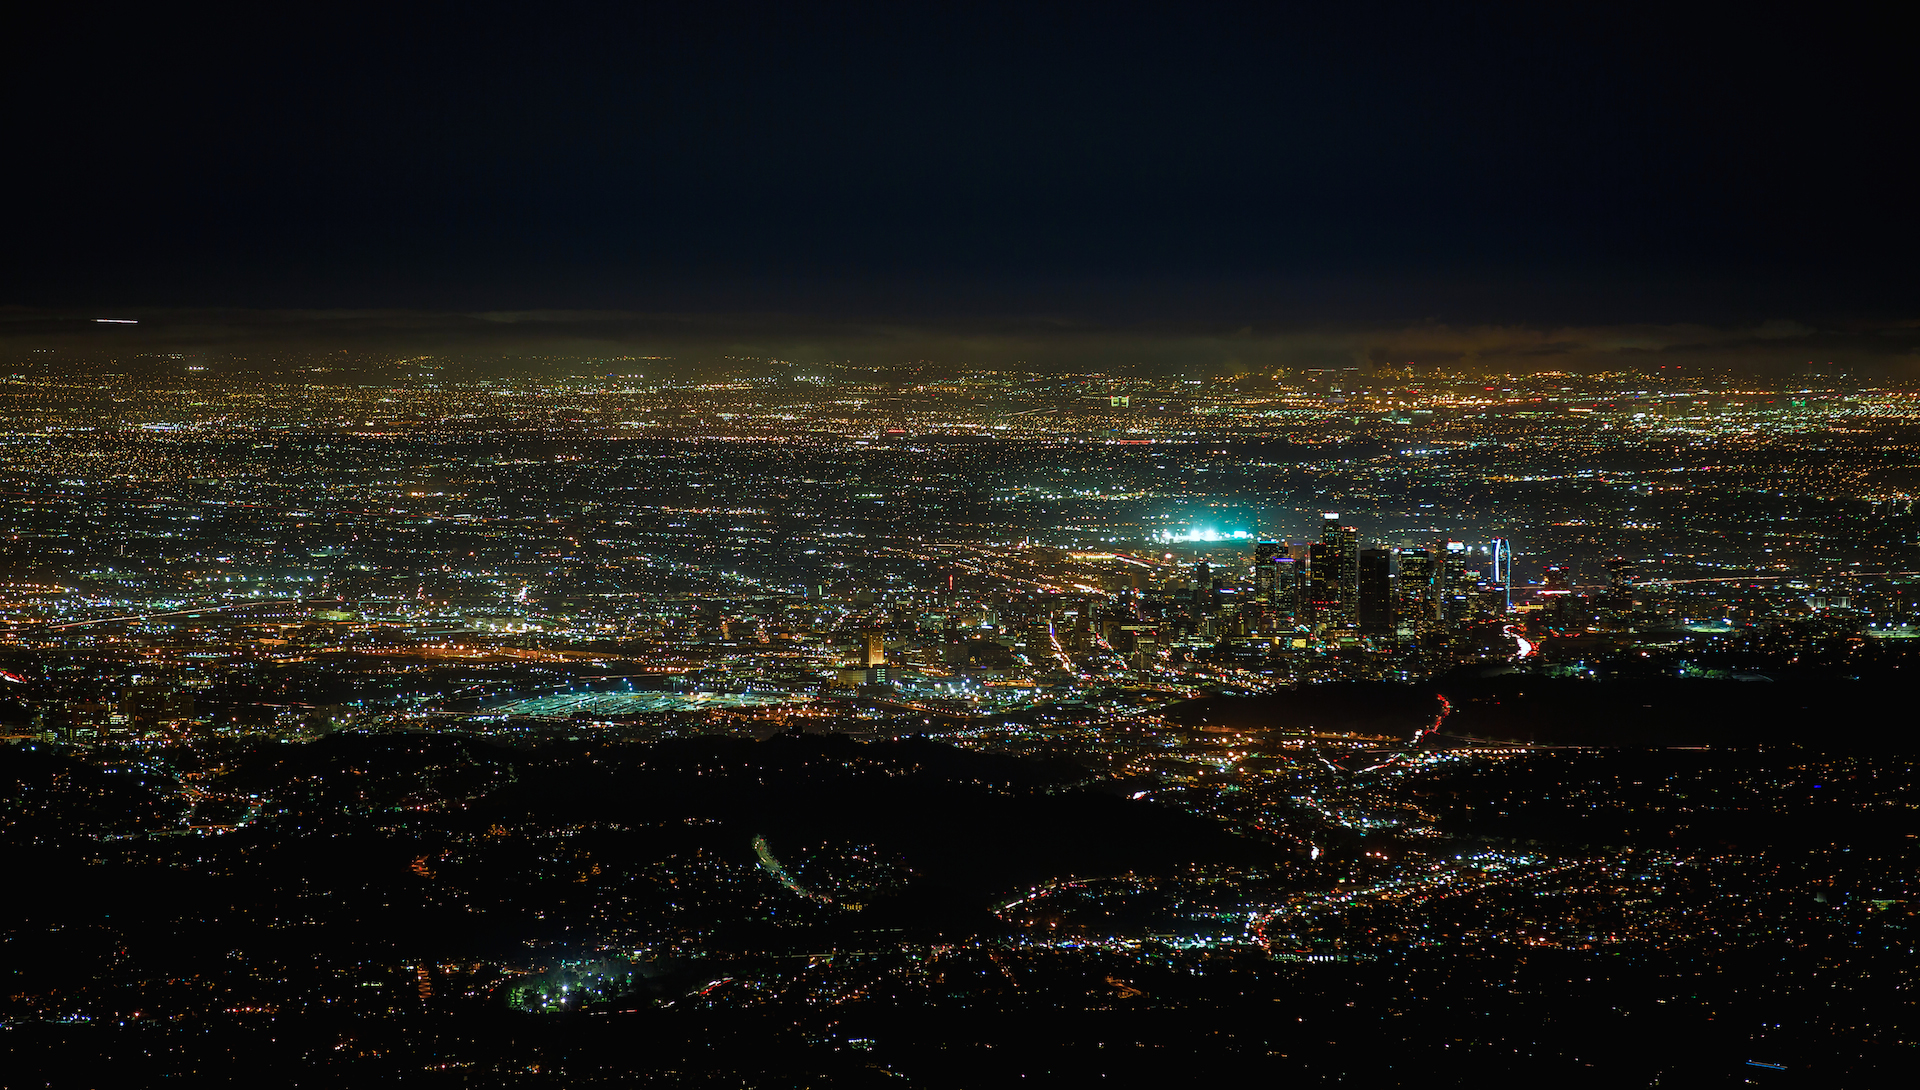
Los Angeles filmmakers Harun Mehmedinovic and Gavin Heffernan's new project, Skyglow, explores humanity's severed link with the night sky. Courtesy of Harun Mehmedinovic/www.skyglowproject.com
Your chances of being attacked, robbed, or struck by a car are no worse on a dimly lit street. And yet, like cavemen huddled around a campfire, humans are still comforted by light.

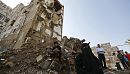
Most of the 7 billion people on planet Earth have never seen the Milky Way. And within a decade, studies suggest that the spread of artificial light will wipe out the night sky’s most distinct feature in all but a few remote places within the United States.
Until relatively recently, human history was recorded in the stars. And people of all cultures gathered around campfires at night to hear tales of their heroes and gods.
But those stories have faded like the constellations that cradled them, as light pollution’s global reach expands by 6 percent every year. Strangely, few people see this as a problem. Even among professional and amateur astronomers vocal opposition to light pollution is rare.
Those who do push for dark-sky regulations face a common refrain: If you dim the lights, crime and traffic collisions will increase. Streetlights make people feel safe at an instinctual level, even though decades of studies have shown there’s no factual basis for that perception.
The latest findings from the University College London (UCL) were released yesterday in theJournal of Epidemiology and Community Health. Researchers looked at 14 years of data from 63 local authorities across England and Wales, searching for trends among agencies that reduced their lighting.
The authors didn’t study why those municipalities turned off the lights, but they say most simply wanted to save money.
Britain turns off the lights
Economic hard times have hit many of England’s cities and towns, as the country’s councils — local governing bodies — are facing cuts in how much cash they receive from the national government. Out of the country’s 150 councils that have authority over their streetlights, about 100 have either dimmed or turned some off in order to save money. One survey estimated that750,000 streetlights — roughly one-third of all British streetlights — have gone dark.
This move to darker skies has also sparked a national debate in the country. The Automobile Association 
claims six people have died as a direct result of dimming the lights.
But that finding was not backed up by the UCL study released yesterday. That research shows less than 1 percent of all nighttime traffic collisions occurred on streets where the lights had been switched off. And overall, the statistics showed no link between accidents and dimming, reducing, or changing the style of streetlights.
Secondly, the researchers looked at lighting’s effect on crime trends. In regions of reduced lighting, they found, there was no increase in burglary, auto theft, robbery, violence, or sexual assault.
“This is very encouraging but it is important to note that it does not mean that this will be the case under all conditions, and so changes to lighting should be managed carefully," study co-author Shane Johnson of UCL Security and Crime Science said in a statement announcing the research.
A companion study conducted by scientists at the London School of Hygiene and Tropical Medicine surveyed 520 people from eight local authorities with varying street light strategies. The researchers found that many residents hadn’t even noticed the lights were turned off, let alone spotted a corresponding uptick in crime.
But while many didn’t realize their neighborhood was darker, others reported “strong concerns” about losing the light. According to the survey, some city-dwellers even saw it as a sign of neglect by local officials.
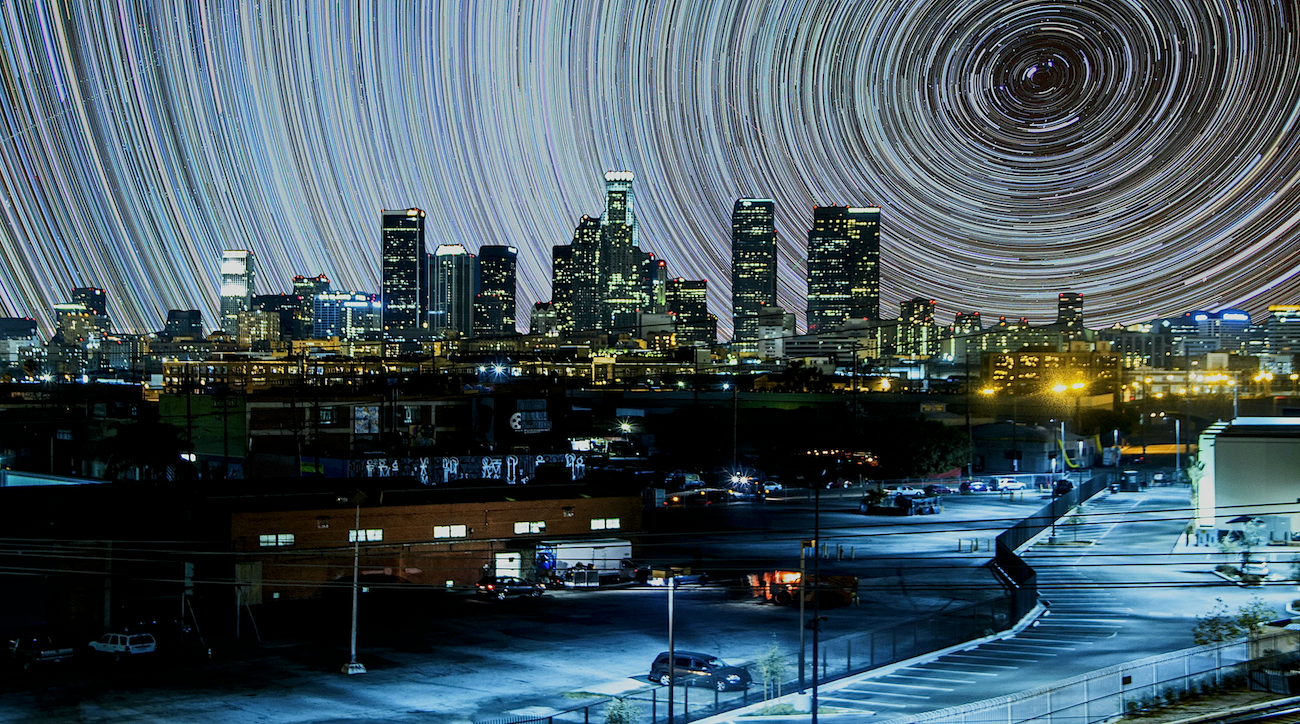
Star trails light up night sky in an imaginary Los Angeles with dark-sky regulations. Harun Mehmedinovic/www.skyglowproject.com
Things that go bump in the night
Dozens of studies have similarly found that reduced lighting isn’t the negative it’s thought to be. In 1991 researchers from the University of Southampton looked at 100,000 crimes under some 3,500 streetlights. The team found that brighter streets had no noticeable impact on crime, but they did make people feel better.
“On the other hand,” the report summary reads, “they did find that the improved street lighting was warmly welcomed by the public, and that it provided a measure of reassurance...”
The public isn’t alone in ignoring the science either. Police also see bright lights as a crime deterrent.
Last year, Smith College astronomy professor James Lowenthal tried to get the city council in Northampton, Massachusetts, to start shielding new LED streetlights and implement a curfew on businesses that lit up empty parking lots late at night.
The city’s police chief of 20 years, Russell Sienkiewicz, showed up to fight the measure, repeating a line often used by law enforcement: The only thing better for preventing crime than more cops is more lights.
“I would ask just for you to consider if good lighting is important,” Sienkiewicz said, according to the Daily Hampshire Gazette. “If you’re a nurse or a clerk working late and you have to walk in a dark parking lot because you are half-hour behind when a business is closed, would lighting be good for you? Would you feel comfortable?”
In a story in June’s Astronomy magazine, Lowenthal said that even the police headquarters has unshielded streetlights, installed in violation of the city’s existing dark-skies ordinance.
And, in fact, if you’re worried about being victimized, your concerns are often better placed in broad daylight. That’s when — in certain cities at least — crime statistics show you’re most likely to be assaulted (though you are often more likely to get shot at night). Most home break-ins also happen during the day. And the hours just before dawn — the darkest — are also often those with the least crime.
Trulia, the online real estate company, released a series of infographics last year that organized crime stats from across the country by time of day. Their website lets you play with this data in your own neighborhood to see for yourself. 
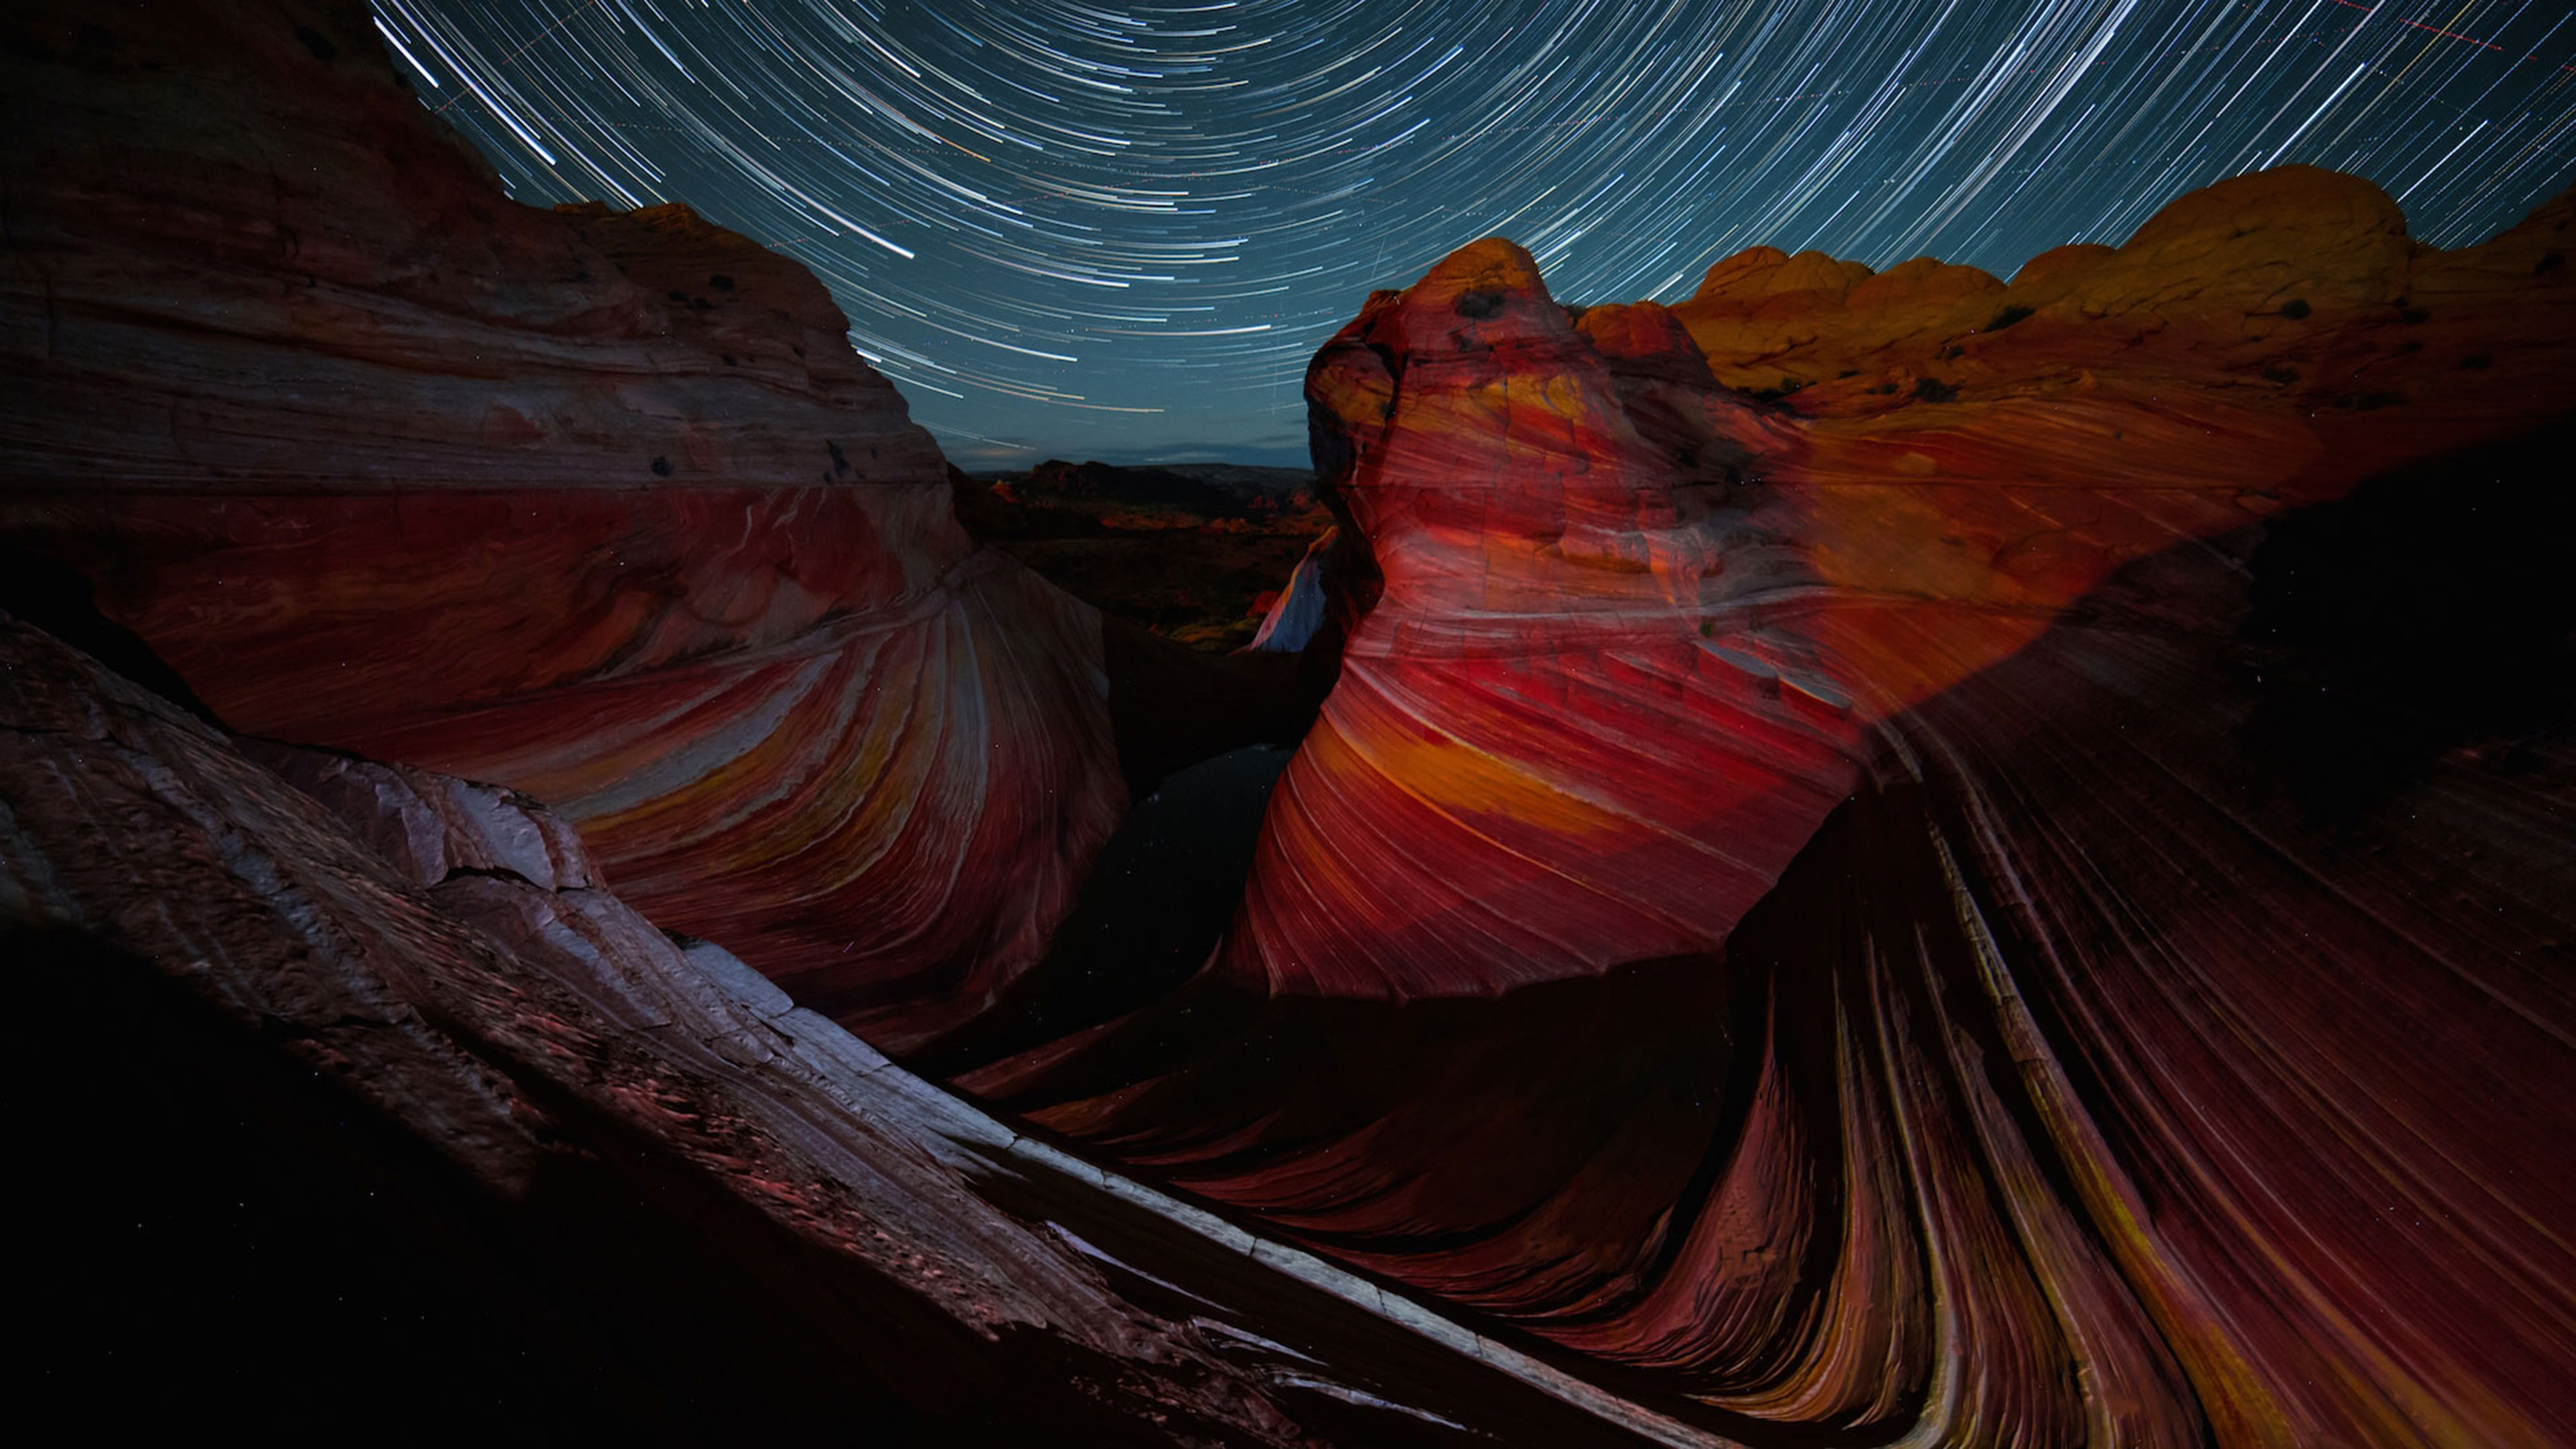
With no nearby cities, Utah's Vermillion Cliffs have some of America's darkest skies. Harun Mehmedinovic/www.skyglowproject.com
The white-light night
And there’s one final, tragic irony about this obsession with lighting the night. Biologists have built a troubling body of evidence that it’s actually killing us, as well as many of the other animals fine-tuned for a 24-hour day-night cycle.
Breast cancer studies show artificial light disrupts the circadian clock and accelerates tumor growth. Scientists are only just beginning to understand many other health impacts, but theAmerican Medical Association has already recommended that cities reduce light pollution and that individuals limit shift work and avoid screentime after dark.
The problem is worse for our fellow organisms. About two-thirds of invertebrates and one-third of vertebrates are nocturnal, and our artificial lights are wreaking havoc on them. From sea turtles and snakes to bats and birds, artificial lights disrupt many animals’ nighttime navigation. Countless insects — including crucial nighttime pollinators like moths — are also drawn in.
Some scientists think the combined result could put entire ecosystems at risk. A recent study in New Zealand showed that certain insects were 48 percent more attracted to the new, more efficient LED lamps many cities are installing than they were to the old school high-pressure sodium vapor streetlights. The researchers said widespread use of the new technology could lead to a “white-light night” that worsens the ecological impact of light pollution.
In the end, this white-light night’s perceived protection has become a greater threat than anything that goes bump within it.
Eric Betz is associate editor of Astronomy. His June story “A new fight for the night” covered the rise of LED streetlights. He’s on Twitter: @ericbetz

Louis Sheehan uploaded but did not write this article.


Salt flat indicates some of the last vestiges of surface water on Mars

Salt flat indicates some of the last vestiges of surface water on Mars

Digital terrain mapping and mineralogical analysis of the features surrounding the deposit indicate that this one-time lakebed is no older than 3.6 billion years old.
RELATED TOPICS: SOLAR SYSTEM | MARS | WATER
Mars_ChlorideDeposit
A perspective rendering of the martian chloride deposit and surrounding terrain.
LASP/Brian Hynek
Mars turned cold and dry long ago, but researchers at the University of Colorado Boulder have discovered evidence of an ancient lake that likely represents some of the last potentially habitable surface water ever to exist on the Red Planet.

The study examined an 18-square-mile (47 square kilometers) chloride salt deposit in the planet’s Meridiani region near the Mars Opportunity rover’s landing site. As seen on Earth in locations such as Utah’s Bonneville Salt Flats, large-scale salt deposits are considered to be evidence of evaporated bodies of water.

Digital terrain mapping and mineralogical analysis of the features surrounding the deposit indicate that this one-time lakebed is no older than 3.6 billion years old, well after the time period when Mars is thought to have been warm enough to sustain large amounts of surface water planet-wide. Planetary scientists believe that the solar system formed approximately 4.6 billion years ago.

“This was a long-lived lake, and we were able to put a very good time boundary on its maximum age,” said Brian Hynek, a research associate at the Laboratory for Atmospheric and Space Physics at CU-Boulder and lead author of the study. “We can be pretty certain that this is one of the last instances of a sizable lake on Mars.” 

Based on the extent and thickness of the salt, the researchers estimate that the lake was only about 8 percent as salty as the Earth’s oceans and therefore may have been hospitable to microbial life.

“By salinity alone, it certainly seems as though this lake would have been habitable throughout much of its existence,” said Hynek, who is also an associate professor in the Department of Geological Sciences at CU-Boulder and director of the CU Center for Astrobiology. He noted, however, that other factors such as acidity levels were not included in the scope of the study.


Uploaded but not written by Louis Sheehan.

Corrected sunspot history suggests climate change since the Industrial Revolution not due to natural solar trends

Corrected sunspot history suggests climate change since the Industrial Revolution not due to natural solar trends

After uncovering a major calibration error, scientists show that the newly corrected sunspot numbers now provide a homogenous record of solar activity dating back some 400 years.
RELATED TOPICS: SOLAR SYSTEM | SUN | SUNSPOTS | EARTH
Sunspots
NASA/SDO/HMI
The Sunspot Number, the longest scientific experiment still ongoing, is a crucial tool used to study the solar dynamo, space weather, and climate change. It has now been recalibrated and shows a consistent history of solar activity over the past few centuries. The new record shows no significant long-term upward trend in solar activity since 1700, as was previously indicated. This suggests that rising global temperatures since the Industrial Revolution cannot be attributed to increased solar activity. The analysis, its results, and its implications for climate research were made public at he International Astronomical Union XXIX General Assembly, currently taking place in Honolulu, Hawaii.

The Maunder minimum, between 1645 and 1715, when sunspots were scarce and the winters harsh, strongly suggests a link between solar activity and climate change. Until now there was a general consensus that solar activity has been trending upward over the past 300 years (since the end of the Maunder minimum), peaking in the late 20th century — called the Modern Grand Maximum by some.

This trend has led some to conclude that the Sun has played a significant role in modern climate change. However, a discrepancy between two parallel series of sunspot number counts has been a contentious issue among scientists for some time.
CorrectedSunspotNumber
The top graph shows the level of disagreement between the old Wolf Sunspot Number (blue) and the old Group Sunspot Number (red). The lower graph demonstrates the increase in similarity between the two after being recalibrated.
WDC-SILSO
The two methods of counting the sunspot number — the Wolf Sunspot Number and the Group Sunspot Number — indicated significantly different levels of solar activity before about 1885 and also around 1945. With these discrepancies now eliminated, there is no longer any substantial difference between the two historical records.

The new correction of the sunspot number, called the Sunspot Number Version 2.0, led by Frédéric Clette, director of the World Data Centre–SILSO, Ed Cliver of the National Solar Observatory, and Leif Svalgaard of Stanford University, nullifies the claim that there has been a Modern Grand Maximum.

The results make it difficult to explain the observed changes in the climate that started in the 18th century and extended through the Industrial Revolution to the 20th century as being significantly influenced by natural solar trends.

The sunspot number is the only direct record of the evolution of the solar cycle over multiple centuries and is the longest scientific experiment still ongoing.

The apparent upward trend of solar activity between the 18th century and the late 20th century has now been identified as a major calibration error in the Group Sunspot Number. Now that this error has been corrected, solar activity appears to have remained relatively stable since the 1700s.

The newly corrected sunspot numbers now provide a homogenous record of solar activity dating back some 400 years. Existing climate evolution models will need to be reevaluated given this entirely new picture of the long-term evolution of solar activity. This work will stimulate new studies both in solar physics (solar cycle modeling and predictions) and climatology, and can be used to unlock tens of millennia of solar records encoded in cosmogenic nuclides found in ice cores and tree rings. This could reveal more clearly the role the Sun plays in climate change over much longer timescales.


Louis Sheehan uploaded this but did not write this.

Tuesday, August 11, 2015

Snowden, Assange and Manning statues unveiled in Berlin

smaller_textlarger_text
"The sculptures represent three contemporary heroes who have lost their freedom for the truth."
Taking a stand in Berlin’s Alexanderplatz are whistleblowers Chelsea Manning, Julian Assange and Edward Snowden.
The life-size bronze statues were unveiled on Friday in front of members of the German Green Party as well as activists.
All three figures are considered heroes on the political left for leaking US intelligence documents.
The artist behind the work Italian sculptor Davide Dormino explains that he wanted to “represent three contemporary heroes who have lost their freedom for the truth.” He says that they act as a reminder of “how important it is to know the truth and have the courage to know the truth.”
Entitled Anything to Say the sculpture encourages supporters to stand up for freedom of speech and information.
Wikileaks founder Julian Assange faces extradition to Sweden to face investigation into accusations of rape and sexual assault, but fears he will be extradited to the US to face questions over his role in leaking secret US documents. He has taken asylum in Ecuador’s London Embassy. US soldier Chelsea Manning (born Bradley Manning) was convicted in 2013 on charges relating to the Espionage Act for leaking US intelligence and military documents to Wikileaks. She is currently serving a 35 year prison sentence. Edward Snowden is currently evading extradition to the US by taking asylum in Russia. He released classified information from the National Security Agency (NSA) to journalists revealing the scale of the US government’s global surveillance capabilities.
Their statues will have fewer restrictions on their movements with a scheduled world tour.
If you are in Berlin the sculptures can be found here at Die ökologische Kulturoase .

List of countries by exports From Wikipedia, the free encyclopedia

List of countries by exports

From Wikipedia, the free encyclopedia
Quartile map of amount of exports per country.
This is a list of countries by merchandise exports, based on the The World Factbook of the CIA.[1]
RankCountryExportsDate of
information
 World$17,779,000,000,000[2]2011 est.
1 China$2,252,000,000,0002014 est.
 European Union$2,173,000,000,0002012 est.
2 United States$1,610,000,000,0002014 est.
3 Germany$1,547,000,000,0002014 est.
4 Japan$710,500,000,0002014 est.
5 South Korea$628,000,000,0002014 est.
6 France$578,300,000,0002014 est.
7 Netherlands$552,800,000,0002014 est.
China Hong Kong$528,200,000,0002014 est.
8 Russia$520,300,000,0002014 est.
9 United Kingdom$503,400,000,0002014 est.
10 Italy$500,300,000,0002014 est.
11 Canada$465,100,000,0002014 est.
12 Singapore$449,100,000,0002014 est.
13 Mexico$406,400,000,0002014 est.
14 United Arab Emirates$404,700,000,0002014 est.
15  Switzerland$388,900,000,0002014 est.
16 Saudi Arabia$359,400,000,0002014 est.
17 India$342,500,000,0002014 est.
18 Belgium$323,400,000,0002014 est.
 Taiwan$318,000,000,0002014 est.
19 Spain$317,300,000,0002014 est.
20 Australia$250,800,000,0002014 est.
21 Brazil$242,700,000,0002014 est.
22 Thailand$232,000,000,0002014 est.
23 Malaysia$231,300,000,0002014 est.
24 Poland$218,900,000,0002014 est.
25 Sweden$184,100,000,0002014 est.
26 Indonesia$179,400,000,0002014 est.
27 Turkey$176,600,000,0002014 est.
28 Austria$164,400,000,0002014 est.
29 Norway$150,200,000,0002014 est.
30 Czech Republic$147,300,000,0002014 est.
31 Vietnam$147,000,000,0002014 est.
32 Ireland$121,300,000,0002014 est.
33 Qatar$121,200,000,0002014 est.
34 Kuwait$109,900,000,0002014 est.
35 Denmark$108,800,000,0002014 est.
36 Hungary$99,540,000,0002014 est.
37 South Africa$97,900,000,0002014 est.
38 Iran$95,710,000,0002014 est.
39 Iraq$94,430,000,0002014 est.
40 Nigeria$93,010,000,0002014 est.
41 Kazakhstan$87,250,000,0002014 est.
42 Slovakia$86,550,000,0002014 est.
43 Venezuela$83,200,000,0002014 est.
44 Finland$78,000,000,0002014 est.
45 Chile$76,980,000,0002014 est.
46 Argentina$76,470,000,0002014 est.
47 Angola$69,460,000,0002014 est.
United States Puerto Rico$68,340,000,0002014 est.
48 Portugal$66,300,000,0002014 est.
49 Romania$63,120,000,0002014 est.
50 Algeria$62,100,000,0002014 est.
51 Israel$63,210,000,0002014 est.
52 Oman$58,740,000,0002014 est.
53 Colombia$55,000,000,0002014 est.
54 Philippines$53,360,000,0002014 est.
55 Ukraine$52,460,000,0002014 est.
56 New Zealand$40,210,000,0002014 est.
57 Belarus$37,890,000,0002014 est.
58 Greece$36,600,000,0002014 est.
59 Peru$36,430,000,0002014 est.
60 Lithuania$31,640,000,0002014 est.
61 Bangladesh$31,200,000,0002014 est.
62 Azerbaijan$30,890,000,0002014 est.
63 Slovenia$30,470,000,0002014 est.
64 Bulgaria$29,250,000,0002014 est.
65 Ecuador$27,330,000,0002014 est.
66 Egypt$27,150,000,0002014 est.
67 Pakistan$25,110,000,0002014 est.
68 Bahrain$22,000,000,0002014 est.
69 Turkmenistan$21,780,000,0002014 est.
70 Morocco$19,560,000,0002014 est.
71 Luxembourg$18,900,000,0002014 est.
72 Panama$18,070,000,0002014 est.
73 Libya$17,490,000,0002014 est.
74 Tunisia$16,610,000,0002014 est.
75 Estonia$15,820,000,0002014 est.
76 Serbia$15,000,000,0002014 est.
77 Paraguay$14,610,000,0002014 est.
78 Cote d'Ivoire$14,580,000,0002014 est.
79 Croatia$14,080,000,0002014 est.
80 Ghana$13,530,000,0002014 est.
81 Latvia$13,380,000,0002014 est.
82 Uzbekistan$13,320,000,0002014 est.
83 Equatorial Guinea$13,260,000,0002014 est.
84 Trinidad and Tobago$12,610,000.0002014 est.
85 Bolivia$12,340,000,0002014 est.
86 Sri Lanka$11,880,000,0002014 est.
87 Costa Rica$11,750,000,0002014 est.
88 Brunei$11,380,000,0002014 est.
89 Uruguay$11,000,000,0002014 est.
90 Guatemala$10,600,000,0002014 est.
91 Burma$10,310,000,0002014 est.
92 Dominican Republic$10,110,000,0002014 est.
93 Democratic Republic of the Congo$10,090,000,0002014 est.
94 Republic of the Congo$8,972,000,0002014 est.
95 Zambia$8,547,000,0002013 est.
96 Gabon$8,401,000,0002014 est.
97 Jordan$7,914,000,0002013 est.
98 Honduras$7,881,000,0002013 est.
99 Botswana$7,569,000,0002013 est.
100 Cambodia$6,781,000,0002013 est.
101 Yemen$6,694,000,0002013 est.
102 Kenya$6,580,000,0002013 est.
103 Cuba$6,252,000,0002013 est.
104 Cameroon$6,002,000,0002013 est.
105 Tanzania$5,920,000,0002013 est.
106 Lebanon$5,826,000,0002013 est.
107 Papua New Guinea$5,392,000,0002013 est.
108 Iceland$5,200,000,0002013 est.
109 Namibia$5,124,000,0002013 est.
110 El Salvador$5,112,000,0002013 est.
111 Mongolia$4,294,000,0002013 est.
112 Nicaragua$4,278,000,0002013 est.
United States U.S. Virgin Islands$4,234,000,0002001 est.
113 Sudan$4,145,000,0002013 est.
114 Malta$4,127,000,0002013 est.
115 Macedonia$4,095,000,0002013 est.
116 North Korea$3,954,000,0002012 est.
117 Mozambique$3,920,000,0002013 est.
118 Chad$3,865,000,0002013 est.
119 San Marino$3,827,000,0002011 est.
120 Liechtenstein$3,760,000,0002011 est.
121 Bosnia and Herzegovina$3,571,000,0002013 est.
122 Ethiopia$3,214,000,0002013 est.
123 Uganda$3,156,000,0002013 est.
124 Zimbabwe$3,144,000,0002013 est.
125 Burkina Faso$2,844,000,0002013 est.
126 Mauritius$2,788,000,0002013 est.
127 Mauritania$2,728,000,0002013 est.
128 Senegal$2,691,000,0002013 est.
129 Syria$2,675,000,0002013 est.
130 Georgia$2,618,000,0002013 est.
131 Mali$2,577,000,0002013 est.
132 Suriname$2,512,000,0002013 est.
133 Cyprus$2,420,000,0002013 est.
134 Laos$2,313,000,0002013 est.
135 Moldova$2,310,000,0002013 est.
Netherlands Aruba$2,222,000,0002013 est.
136 Kyrgyzstan$1,881,000,0002013 est.
 Jamaica$1,775,000,0002013 est.
137 Armenia$1,653,000,0002013 est.
138 Swaziland$1,603,000,0002013 est.
139 Sierra Leone$1,563,000,0002013 est.
140 Niger$1,539,000,0002013 est.
Netherlands Curacao$1,500,000,0002011 est.
141 Malawi$1,427,000,0002013 est.
142 Guyana$1,337,000,0002013 est.
France New Caledonia$1,311,000,0002012 est.
143 Guinea$1,310,000,0002013 est.
144 Albania$1,226,000,0002013 est.
145 Benin$1,108,000,0002013 est.
146   Nepal$1,060,000,0002013 est.
 Barbados$1,051,000,0002013 est.
147 Fiji$1,026,000,0002013 est.
China Macau$1,020,600,0002012 est.
148 Togo$982,200,0002013 est.
 The Bahamas$960,000,0002013 est.
149 Lesotho$941,200,0002013 est.
150 Liberia$929,800,0002013 est.
151 Haiti$876,800,0002013 est.
152 Tajikistan$825,600,0002013 est.
Denmark Faroe Islands$824,000,0002010 est.
153 Monaco$802,400,0002011 est.
154 Bhutan$721,800,0002012 est.
155 West Bank$666,100,0002010 est.
156 Madagascar$644,400,0002013 est.
 Belize$633,000,0002013 est.
157 Rwanda$538,300,0002013 est.
158 Seychelles$516,700,0002013 est.
159 Somalia$515,800,0002012 est.
160 Eritrea$496,200,0002013 est.
 Solomon Islands$493,100,0002011 est.
161 Montenegro$489,200,0002012 est.
United States American Samoa$445,600,000FY04 est.
162 Kosovo$419,000,0002011 est.
Denmark Greenland$384,300,0002010 est.
163 Afghanistan$376,000,0002012 est.
164 Maldives$283,000,0002012 est.
United Kingdom Gibraltar$271,000,0002004 est.
 Saint Lucia$206,800,0002013 est.
 French Polynesia$200,000,0002008 est.
165 Cape Verde$159,900,0002013 est.
166 Guinea-Bissau$147,600,0002013 est.
167 Central African Republic$138,900,0002013 est.
United Kingdom Falkland Islands$125,000,0002004 est.
168 Burundi$122,800,0002013 est.
169 The Gambia$113,200,0002013 est.
 Northern Mariana Islands$98,200,0002008 est.
170 Djibouti$90,800,0002013 est.
171 Andorra$70,000,0002012 est.
 Saint Kitts and Nevis$57,300,0002013 est.
 Antigua and Barbuda$55,000,0002013 est.
172 Marshall Islands$50,140,0002011 est.
 Saint Vincent and the Grenadines$45,700,0002013 est.
United States Guam$44,000,0002011 est.
173 Vanuatu$43,100,0002013 est.
 Grenada$40,500,0002012 est.
174 Dominica$40,400,0002013 est.
175 Timor-Leste$34,100,0002011 est.
United Kingdom British Virgin Islands$26,000,0002012 est.
176 Federated States of Micronesia$24,900,0002009 est.
United Kingdom Turks and Caicos Islands$24,770,0002008 est.
177 Comoros$19,700,0002013 est.
 Saint Helena, Ascension and Tristan da Cunha$19,000,0002004 est.
United Kingdom Cayman Islands$13,900,0002013 est.
United Kingdom Bermuda$13,000,0002013 est.
178 Palau$12,300,0002010 est.
United Kingdom Anguilla$12,200,0002013 est.
179 Sao Tome and Principe$12,100,0002013 est.
180 Samoa$11,400,0002011 est.
181 Tonga$9,100,0002013 est.
182 Kiribati$7,066,0002010 est.
 Saint Pierre and Miquelon$6,641,0002010 est.
 Cook Islands$5,222,0002005 est.
United Kingdom Montserrat$3,600,0002013 est.
 Tuvalu$600,0002010 est.
 Niue$201,4002004 est.
183 Nauru$64,0002005 est.
 Wallis and Futuna$47,4502004 est.
New Zealand Tokelau$02002 est.


Louis Sheehan